

TrustRadius Insights
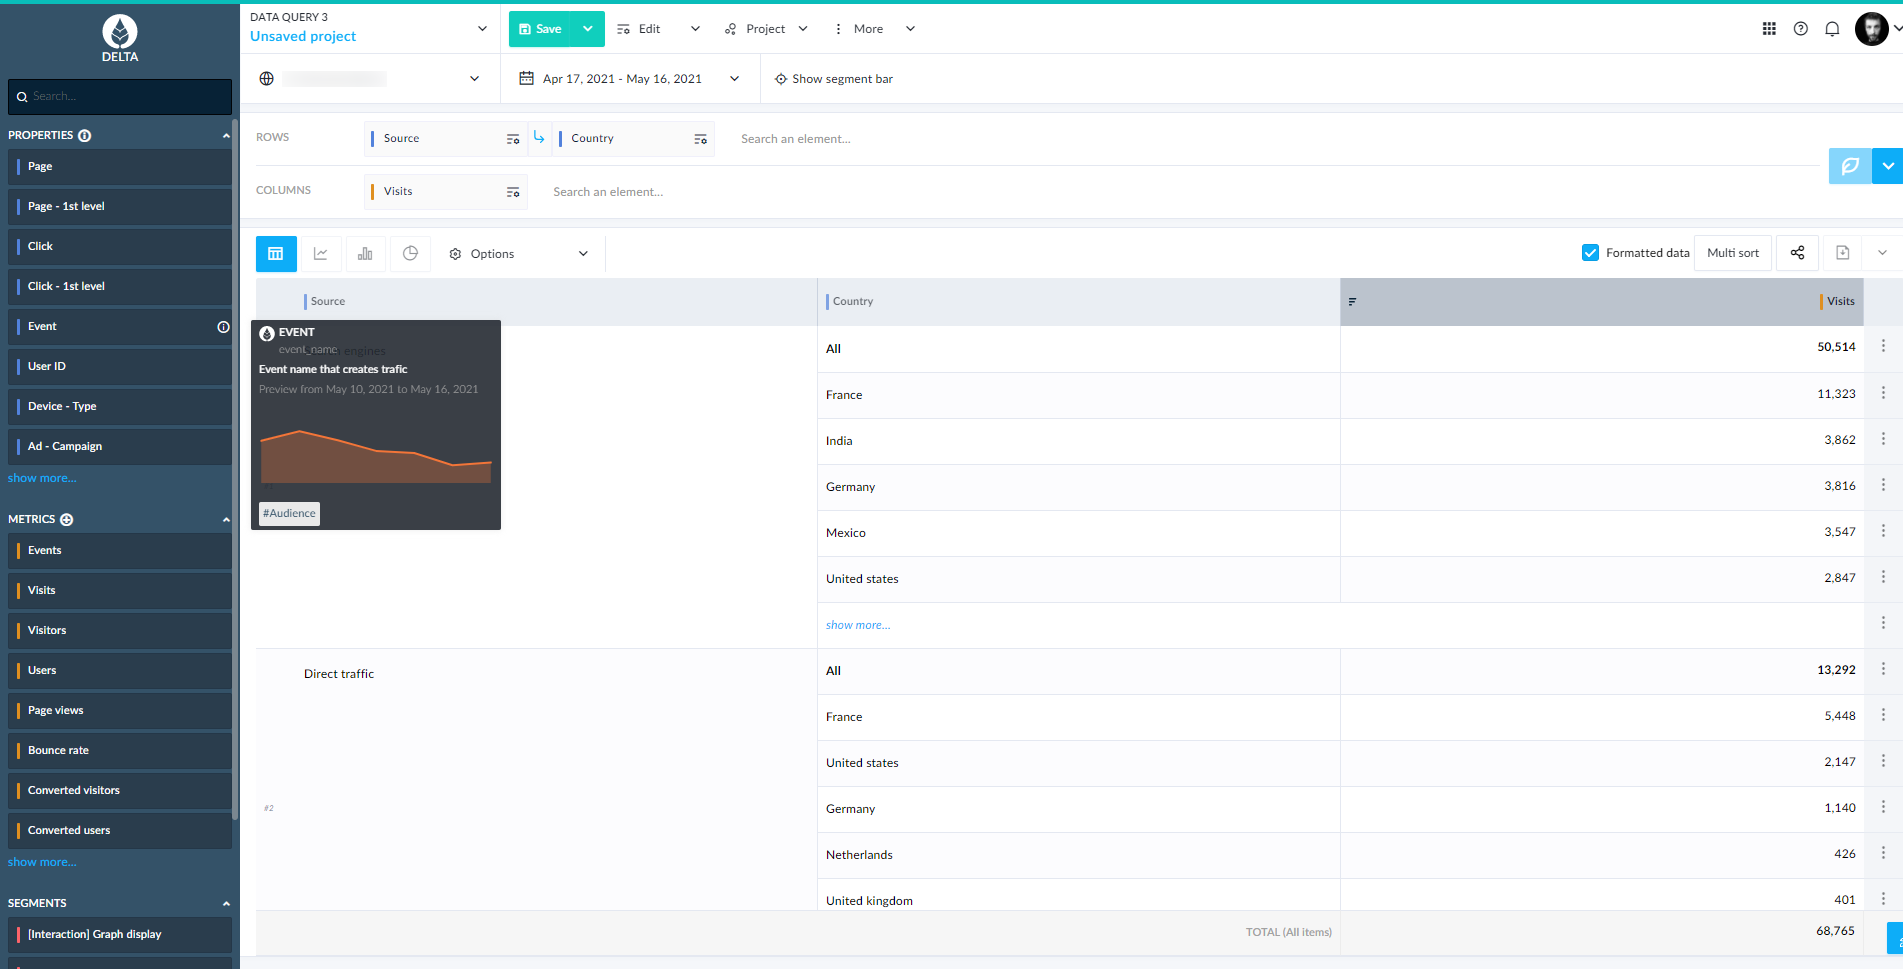
Powerful Query Builder: Users have praised AT Internet for its powerful query builder, which allows for almost limitless flexibility in …
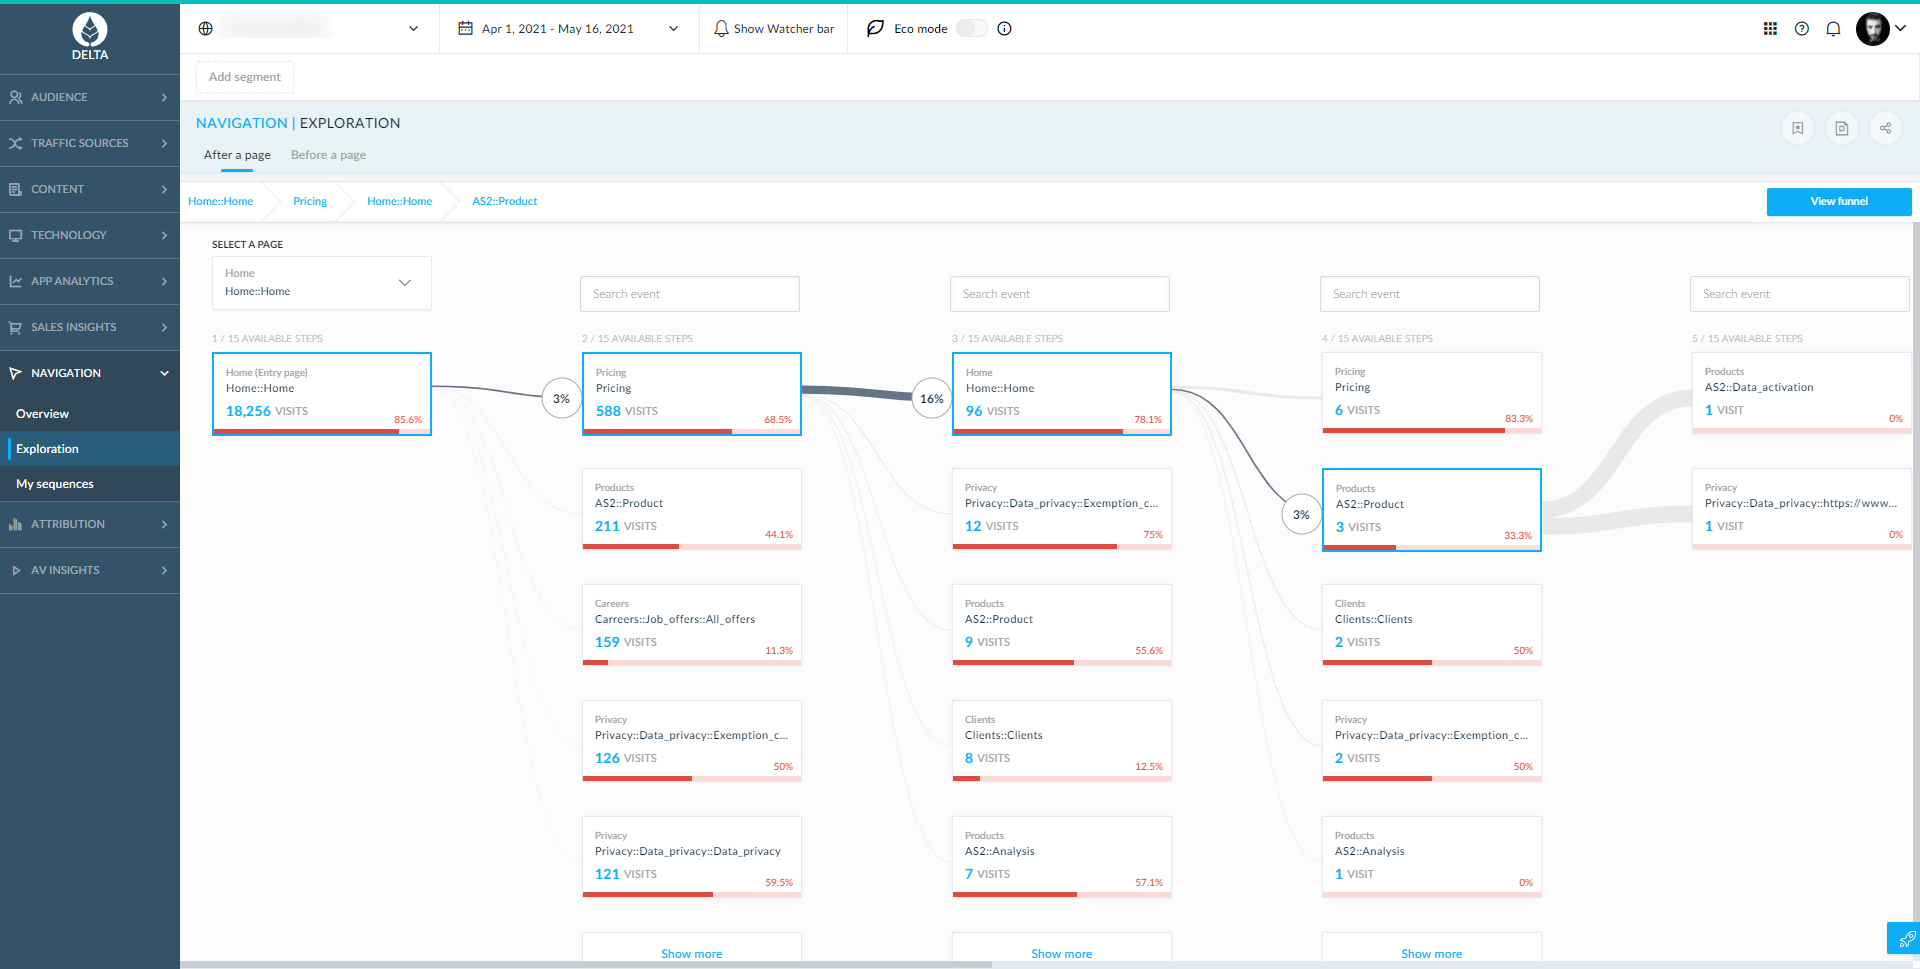
Piano Analytics, formerly AT Internet, provides digital analytics to help customers measure their audience, optimise their digital performance and create value. From data collection to exploration, activation, and the sharing of actionable insights, the Piano Analytics Suite is designed to…
Products that are considered exceptional by their customers based on a variety of criteria win TrustRadius awards. Learn more about the types of TrustRadius awards to make the best purchase decision. More about TrustRadius Awards


| Deployment Types | Software as a Service (SaaS), Cloud, or Web-Based |
|---|---|
| Operating Systems | Unspecified |
| Mobile Application | Apple iOS, Android |
| Supported Languages | French, English, German, Spanish. |
| Consumers | 0% |
|---|---|
| Small Businesses (1-50 employees) | 35% |
| Mid-Size Companies (51-500 employees) | 45% |
| Enterprises (more than 500 employees) | 20% |
Users have provided the following recommendations for AT Internet:
Overall, users recommend AT Internet as a powerful tool for tracking web analytics and presenting data in user-friendly formats. Proper training or familiarity with similar tools may be necessary to fully utilize its capabilities.